It’s really easy to just tap a button on our mobile phone and get the cab available within few minutes whenever and wherever we want.
Uber/Ola/Lyft… using these applications and getting the hassle-free transportation service is really simple but is it also simple to build these gigantic applications which have hundreds of software engineers working on it for a decade…? definitely not. These systems have much more complex architecture and there are a lot of components joined together internally to provide riding services all over the world. Designing Uber (or OLA or Lyft) is a quite common question of system design round in interviews. A lot of candidates get afraid of this round more than the coding round because they don’t get the idea that what topics and tradeoffs they should cover within this limited timeframe. Firstly, remember that the system design round is extremely open-ended and there’s no such thing as a standard answer. Even for the same question, you’ll have a totally different discussion with different interviewers.

In this blog, we will discuss how to design ride-hailing services like Uber/Ola/Lyft but before we go further we want you to read the article “How to crack system design round in interviews?”. It will give you an idea that what this round looks like, what you are expected to do, and what mistakes you should avoid in front of the interviewer.
We all are familiar with Uber services. A user can request a ride through the application and within a few minutes, a driver arrives nearby his/her location to take them to their destination. Earlier Uber was built on the “monolithic” software architecture model. They had a backend service, a frontend service, and a single database. They used Python and its frameworks and SQLAlchemy as the ORM layer to the database. This architecture was fine for a small number of trips in a few cities but when the service started expanding in other cities Uber team started facing the issue with the application. After the year 2014 Uber team decided to switch to the “service-oriented architecture” and now Uber also handles food delivery and cargo.
1. Talk About the Challenges
One of the main tasks in Uber service is to match the rider with cabs which means we need two different services in our architecture i.e.
- Supply Service (for cabs)
- Demand Service (for riders)
Uber has a Dispatch system (Dispatch optimization/DISCO) in its architecture to match supply with demands. This dispatch system uses mobile phones and it takes the responsibility to match the drivers with riders (supply to demand).
2. How Dispatch System Works?
DISCO must have these goals…
- Reduce extra driving.
- Minimum waiting time
- Minimum overall ETA
The dispatch system completely works on maps and location data/GPS, so the first thing which is important is to model our maps and location data.
- Earth has a spherical shape so it’s difficult to do summarization and approximation by using latitude and longitude. To solve this problem Uber uses Google S2 library. This library divides the map data into tiny cells (for example 3km) and gives the unique ID to each cell. This is an easy way to spread data in the distributed system and store it easily.
- S2 library gives the coverage for any given shape easily. Suppose you want to figure out all the supplies available within a 3km radius of a city. Using the S2 libraries you can draw a circle of 3km radius and it will filter out all the cells with IDs that lie in that particular circle. This way you can easily match the rider to the driver and you can easily find out the number of cars(supply) available in a particular region.
3. Supply Service And How it Works?
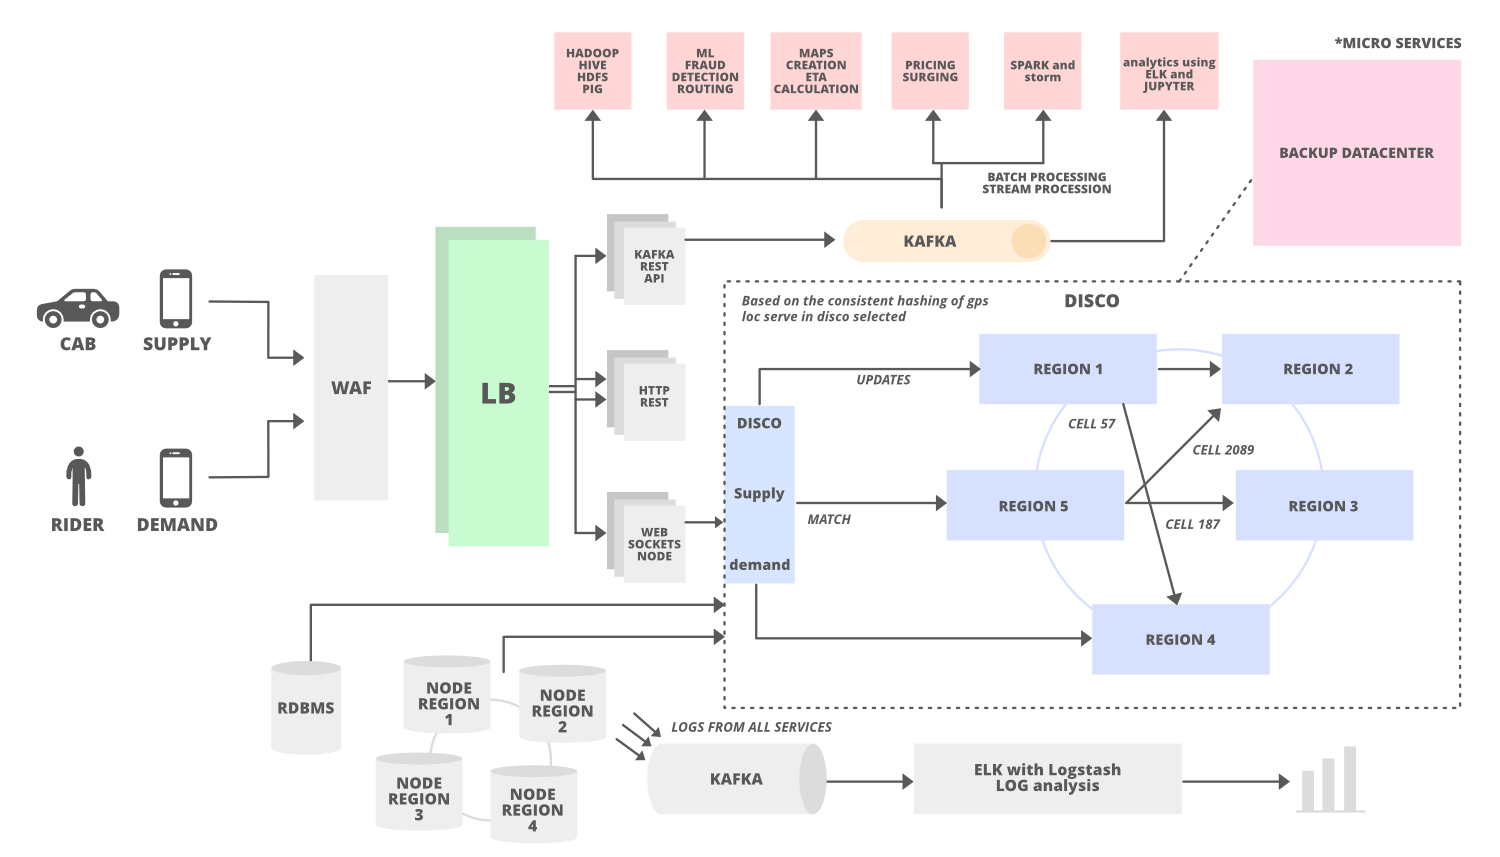
- In our case cabs are the supply services and they will be tracked by geolocation (latitude and longitude). All the active cabs keep on sending the location to the server once every 4 seconds through a web application firewall and load balancer. The accurate GPS location is sent to the data center through Kafka’s Rest APIs once it passes through the load balancer. Here we use Apache Kafka as the data hub.
- Once the latest location is updated by Kafka it slowly passes through the respective worker notes main memory.
- Also a copy of the location (state machine/latest location of cabs) will be sent to the database and to the dispatch optimization to keep the latest location updated.
- We also need to track few more things such as number of seats, presence of a car seat for children, type of vehicle, can a wheelchair be fit, and allocation ( for example, a cab may have four seats but two of those are occupied.)
4. Demand Service And How it Works?
- Demand service receives the request of the cab through a web socket and it tracks the GPS location of the user. It also receives different kinds of requirements such as the number of seats, type of car, or pool car.
- Demand gives the location (cell ID) and user requirement to supply and make requests for the cabs.
5. How Dispatch System Match the Riders to Drivers?
- We have discussed that DISCO divides the map into tiny cells with a unique ID. This ID is used as a sharding key in DISCO. When supply receives the request from demand the location gets updated using the cell ID as a shard key. These tiny cells’ responsibilities will be divided into different servers lies in multiple regions (consistent hashing). For example, we can allocate the responsibility of 12 tiny cells to 6 different servers (2 cells for each server) lies in 6 different regions.
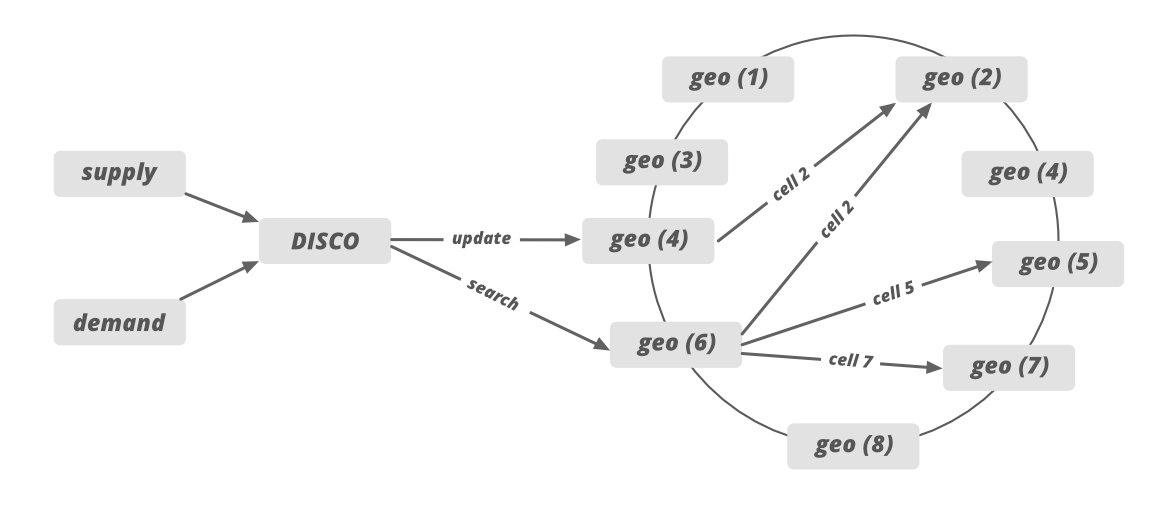
- Supply sends the request to the specific server based on the GPS location data. After that, the system draws the circle and filter out all the nearby cabs which meet the rider’s requirement.
- After that, the list of the cab is sent to the ETA to calculate the distance between the rider and the cab, not geographically but by the road system.
- Sorted ETA is then sent back to the supply system to offer it to a driver.
If we need to handle the traffic for the newly added city then we can increase the number of servers and allocate the responsibilities of newly added cities cell IDs to these servers.
6. How To Scale Dispatch System?
- Dispatch system (including supply, demand, and web socket) is built on NodeJS. NodeJS is the asynchronous and event-based framework that allows you to send and receive messages through WebSockets whenever you want.
- Uber uses an open-source ringpop to make the application cooperative and scalable for heavy traffic. Ring pop has mainly three parts and it performs the below operation to scale the dispatch system.
- It maintains the consistent hashing to assign the work across the workers. It helps in sharding the application in a way that’s scalable and fault-tolerant.
- Ringpop uses RPC (Remote Procedure Call) protocol to make calls from one server to another server.
- Ringpop also uses a SWIM membership protocol/gossip protocol that allows independent workers to discover each other’s responsibilities. This way each server/node knows the responsibility and the work of other nodes.
- Ringpop detects the newly added nodes to the cluster and the node which is removed from the cluster. It distributes the loads evenly when a node is added or removed.
7. How Uber Defines a Map Region?
Before launching a new operation in a new area, Uber onboard the new region to the map technology stack. In this map region, we define various subregions labeled with grades A, B, AB, and C.
Grade A: This subregion is responsible to cover the urban centers and commute areas. Around 90% of Uber traffic gets covered in this subregion, so it’s important to build the highest quality map for subregion A.
Grade B: This subregion covers the rural and suburban areas which are less populated and less traveled by Uber customers.
Grade AB: A union of grade A and B subregions.
Grade C: Covers the set of highway corridors connecting various Uber Territories.
8. How Uber Builds the Map?
Uber uses third party map service provider to build the map in their application. Earlier Uber was using Mapbox services but later Uber switched to Google Maps API to track the location and to calculate ETAs.
1. Trace coverage: Trace coverage spot the missing road segments or incorrect road geometry. Trace coverage calculation is based on two inputs: map data under testing and historic GPS traces of all Uber rides taken over a certain period of time. It covers those GPS traces onto the map, comparing and matching them with road segments. If we find missing road segments (no road is shown) on GPS traces then we take some steps to fix the deficiency.
2. Preferred access (pick-up) point accuracy: We get the pickup point in our application when we book the cab in Uber. Pick-up points are really important metric in Uber especially for large venues such as airports, college campuses, stadiums, factories, or companies. We calculate the distance between the actual location and all the pickup and drop-off points used by drivers.
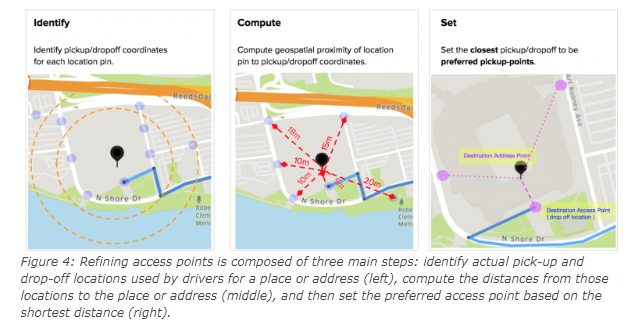
Image Source: https://eng.uber.com/maps-metrics-computation/
The shortest distance (closest pickup point) is then calculated and we set the pin to that location as a preferred access point on the map. When a rider requests the location indicated by the map pin, the map guides the driver to the preferred access point. The calculation continues with the latest actual pick-up and drop-off locations to ensure the freshness and accuracy of the suggested preferred access points. Uber uses machine learning and different algorithms to figure out the preferred access point.
9. How ETAs Are Calculated?
ETA is an extremely important metric in Uber because it directly impacts ride-matching and earnings. ETA is calculated based on the road system (not geographically) and there are a lot of factors involved in computing the ETA (like heavy traffic or road construction). When a rider requests a cab from a location the app not only identifies the free/idle cabs but also includes the cabs which are about to finish a ride. It may be possible that one of the cabs which are about to finish the ride is more close to the demand than the cab which is far away from the user. So many uber cars on the road send GPS locations every 4 seconds, so to predict traffic we can use the driver’s app’s GPS location data.
We can represent the entire road network on a graph to calculate the ETAs. We can use AI simulated algorithms or simple Dijkstra’s algorithm to find out the best route in this graph. In that graph, nodes represent intersections (available cabs), and edges represent road segments. We represent the road segment distance or the traveling time through the edge weight. We also represent and model some additional factors in our graph such as one-way streets, turn costs, turn restrictions, and speed limits.
Once the data structure is decided we can find the best route using Dijkstra’s search algorithm which is one of the best modern routing algorithms today. For faster performance, we also need to use OSRM (Open Source Routing Machine) which is based on contraction hierarchies. Systems based on contraction hierarchies take just a few milliseconds to compute a route — by preprocessing the routing graph.
10. Databases
Uber had to consider some of the requirements for the database for a better customer experience. These requirements are…
- The database should be horizontally scalable. You can linearly add capacity by adding more servers.
- It should be able to handle a lot of reads and writes because once every 4-second cabs will be sending the GPS location and that location will be updated in the database.
- The system should never give downtime for any operation. It should be highly available no matter what operation you perform (expanding storage, backup, when new nodes are added, etc).
Earlier Uber was using the RDBMS PostgreSQL database but due to scalability issues uber switched to various databases. Uber uses a NoSQL database (schemaless) built on the top of the MySQL database.
- Redis for both caching and queuing. Some are behind Twemproxy (provides scalability of the caching layer). Some are behind a custom clustering system.
- Uber uses schemaless (built in-house on top of MySQL), Riak, and Cassandra. Schemaless is for long-term data storage. Riak and Cassandra meet high-availability, low-latency demands.
- MySQL database.
- Uber is building their own distributed column store that’s orchestrating a bunch of MySQL instances.
11. Analytics
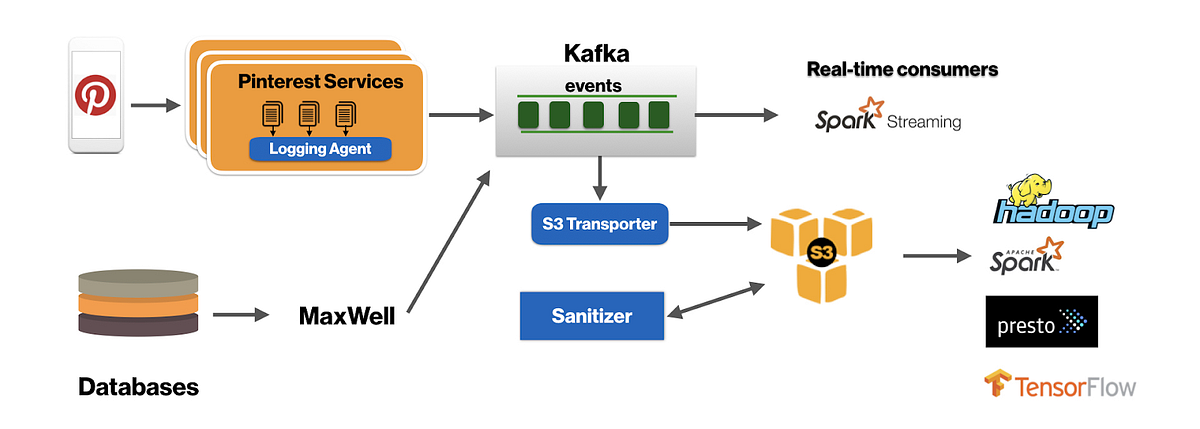
To optimize the system, to minimize the cost of the operation and for better customer experience uber does log collection and analysis. Uber uses different tools and frameworks for analytics. For log analysis, Uber uses multiple Kafka clusters. Kafka takes historical data along with real-time data. Data is archived into Hadoop before it expires from Kafka. The data is also indexed into an Elastic search stack for searching and visualizations. Elastic search does some log analysis using Kibana/Graphana. Some of the analyses performed by Uber using different tools and frameworks are…
- Track HTTP APIs
- Manage profile
- Collect feedback and ratings
- Promotion and coupons etc
- Fraud detection
- Payment fraud
- Incentive abuse by driver
- Compromised accounts by hackers. Uber uses historical data of the customer and some machine learning technique to tackle with this problem.
12. How To Handle The Datacenter Failure?
Datacenter failure doesn’t happen very often but Uber still maintains a backup data center to run the trip smoothly. This data center includes all the components but Uber never copies the existing data into the backup data center.
Then how Uber tackles the datacenter failure??
It actually uses driver phones as a source of trip data to tackle the problem of data center failure.
When The driver’s phone app communicates with the dispatch system or the API call is happening between them, the dispatch system sends the encrypted state digest (to keep track of the latest information/data) to the driver’s phone app. Every time this state digest will be received by the driver’s phone app. In case of a datacenter failure, backup data center (backup DISCO) doesn’t know anything about the trip so it will ask for the state digest from the driver’s phone app and it will update itself with the state digest information received by the driver’s phone app.
GeeksforGeeks System Design Course
Want to get a Software Developer/Engineer job at a leading tech company? or Want to make a smooth transition from SDE I to SDE II or Senior Developer profiles? If yes, then you’re required to dive deep into the System Design world! A decent command over System Design concepts is very much essential, especially for the working professionals, to get a much-needed advantage over others during tech interviews.

And that’s why, GeeksforGeeks is providing you with an in-depth interview-centric System Design – Live Course that will help you prepare for the questions related to System Designs for Google, Amazon, Adobe, Uber, and other product-based companies.